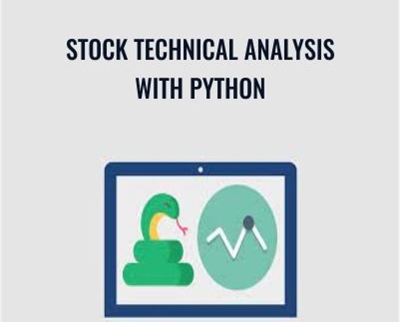
Buy Stock Technical Analysis with Python – Diego Fernandez Course at GBesy. We actively participate in Groupbuys and are committed to sharing knowledge with a wider audience. Rest assured, the quality of our courses matches that of the original sale page. If you prefer, you can also buy directly from the sale page at the full price (the SALEPAGE link is directly provided in the post).
Salepage link: At HERE. Archive:
$197 $34 – Stock Technical Analysis with Python – Diego Fernandez
What you’ll learn
- Read or download S&P 500® Index ETF prices data and perform technical analysis operations by installing related packages and running script code on RStudio IDE.
- Compute lagging stock technical indicators or overlays such as moving averages, Bollinger bands, parabolic stop and reverse.
- Calculate leading stock technical indicators or oscillators such as average directional movement index, commodity channel index, moving averages convergence/divergence, rate of change, relative strength index, stochastic momentum index and Williams %R.
- Determine single technical indicator based stock trading opportunities through price, double, bands, centerline and signal crossovers.
- Define multiple technical indicators based stock trading occasions through price crossovers confirmed by bands crossovers.
- Outline long-only stock trading strategies based on single or multiple technical indicators trading openings.
- Assess stock trading strategies performance by comparing their annualized return, standard deviation and Sharpe ratio against buy and hold benchmark.
Requirements
- R statistical software is required. Downloading instructions included.
- RStudio Integrated Development Environment (IDE) is recommended. Downloading instructions included.
- Practical example data and R script code files are provided with course.
- Prior basic R statistical software knowledge is useful but not required.
Description
Full Course Content Last Update 12/2017
Learn stock technical analysis through a practical course with R statistical software using S&P 500® Index ETF historical data for back-testing. It explores main concepts from basic to expert level which can help you achieve better grades, develop your academic career, apply your knowledge at work or do research as experienced investor. All of this while referencing best practitioners in the field.
Become a Stock Technical Analysis Expert in this Practical Course with R
- Read or download S&P 500® Index ETF prices data and perform technical analysis operations by installing related packages and running script code on RStudio IDE.
- Compute lagging stock technical indicators or overlays such as moving averages, Bollinger bands, parabolic stop and reverse.
- Calculate leading stock technical indicators or oscillators such as average directional movement index, commodity channel index, moving averages convergence/divergence, rate of change, relative strength index, stochastic momentum index and Williams %R.
- Determine single technical indicator based stock trading opportunities through price, double, bands, centerline and signal crossovers.
- Define multiple technical indicators based stock trading occasions through price crossovers confirmed by bands crossovers.
- Outline long-only stock trading strategies based on single or multiple technical indicators trading openings.
- Assess stock trading strategies performance by comparing their annualized return, standard deviation and Sharpe ratio against buy and hold benchmark.
Become a Stock Technical Analysis Expert and Put Your Knowledge in Practice
Learning stock technical analysis is indispensable for finance careers in areas such as equity research and equity trading. It is also essential for academic careers in quantitative finance. And it is necessary for experienced investors stock technical trading research and development.
But as learning curve can become steep as complexity grows, this course helps by leading you step by step using S&P 500® Index ETF prices historical data for back-testing to achieve greater effectiveness.
Content and Overview
This practical course contains 46 lectures and 7 hours of content. It’s designed for all stock technical analysis knowledge levels and a basic understanding of R statistical software is useful but not required.
At first, you’ll learn how to read or download S&P 500® Index ETF prices historical data to perform technical analysis operations by installing related packages and running script code on RStudio IDE.
Next, you’ll calculate lagging stock technical indicators such as simple moving averages (SMA), exponential moving averages (EMA), Bollinger bands (BB), parabolic stop and reverse (SAR). After that, you’ll compute leading stock technical indicators such as average directional movement index (ADX), commodity channel index (CCI), moving averages convergence/divergence (MACD), rate of change (ROC), relative strength index (RSI), stochastic momentum index (SMI) and Williams %R.
Then, you’ll define single technical indicator based stock trading openings through price, double, bands, centerline and signal crossovers. Next, you’ll determine multiple technical indicators based trading opportunities through price crossovers which need to be confirmed by second technical indicator band crossover. Later, you’ll give shape to long-only stock trading strategies using single or multiple technical indicators trading occasions.
Finally, you’ll evaluate stock trading strategies performance with buy and hold as initial benchmark and comparing their annualized return for performance, annualized standard deviation for volatility or risk and annualized Sharpe ratio for risk adjusted return.
Who this course is for:
- Undergraduates or postgraduates at any knowledge level who want to learn about stock technical analysis using R statistical software.
- Finance professionals or academic researchers who wish to deepen their knowledge in quantitative finance.
- Experienced investors who desire to research stock technical trading strategies.
- This course is NOT about “get rich quick” trading systems or magic formulas.
$197 $34 – Stock Technical Analysis with Python – Diego Fernandez
Buy the Stock Technical Analysis with Python – Diego Fernandez course at the best price at GBesy.. After your purchase, you will get access to the downloads page. You can download all the files associated in your order at here and we will also send a download notification email via your mail.
Unlock your full potential with Stock Technical Analysis with Python – Diego Fernandez courses. our courses are designed to help you excel.
Why wait? Take the first step towards greatness by purchasing Stock Technical Analysis with Python – Diego Fernandez courses today. We offer a seamless and secure purchasing experience, ensuring your peace of mind. With our trusted payment gateways, Stripe and PayPal, you can confidently complete your transaction knowing that your financial information is protected.
Stripe, known for its robust security measures, provides a safe and reliable payment process. With its encrypted technology, your sensitive data remains confidential throughout the transaction. Rest assured that your purchase is protected.
PayPal, a globally recognized payment platform, offers an additional layer of security. With its buyer protection program, you can feel confident in your purchase. PayPal ensures that your financial details are safeguarded, allowing you to focus on your learning journey.
Is it secure? to Use of?
- Your identity is completely confidential. We do not share your information with anyone. So it is absolutely safe to buy the Stock Technical Analysis with Python – Diego Fernandez course.
- 100% Safe Checkout Privateness coverage
- Communication and encryption of sensitive knowledge
- All card numbers are encrypted using AES at relaxation-256 and transmitting card numbers runs in a separate internet hosting atmosphere, and doesn’t share or save any data.
How can this course be delivered?
- After your successful payment this “Stock Technical Analysis with Python – Diego Fernandez course”, Most of the products will come to you immediately. But for some products were posted for offer. Please wait for our response, it might take a few hours due to the time zone difference.
- If this happens, please wait. The technical department will process the link shortly after. You will receive notifications directly by e-mail. We appreciate your wait.
What Shipping Methods Are Available?
- You will receive a download link in the invoice or YOUR ACCOUNT.
- The course link always exists. use your account to login and download the Stock Technical Analysis with Python – Diego Fernandez course whenever you need.
- You only need to visit a single link, and you can get all the Stock Technical Analysis with Python – Diego Fernandez course content at once.
- You can do your learning online. You can be downloaded for better results and can study anywhere on any device. Make sure your system does not sleep during the download.
How Do I Track Order?
- We always notice the status of your order immediately after your payment. After 7 days if there is no download link, the system will automatically complete your money.
- We love to hear from you. Please don’t hesitate to email us with any comments, questions and suggestions.
![GBesy [GB] GBesy [GB]](https://www.gbesy.com/wp-content/uploads/2023/05/gbesy-Logo-full-100.png)














![[ETA] Energetic Throat [Chakra] Activation - Rudy Hunter](https://www.gbesy.com/wp-content/uploads/2023/05/Rudy-Hunter-5BETA5D-Energetic-Throat-5BChakra5D-Activation.jpg)




![[Audio] EP17 Topical Panel 07 - Mind/Body Issues - Robert Dilts](https://www.gbesy.com/wp-content/uploads/2023/07/Audio-Only-EP17-Topical-Panel-07-Mind-Body-Issues-Robert-Dilts-BA-Stephen-Gilligan-PhD-and-Daniel-Siegel-MD.png)
 Purchase this course you will earn


Reviews
There are no reviews yet.